Détail du package

@syncfusion/ej2-heatmap

syncfusion44.6kSEE LICENSE IN license29.1.33

Feature rich data visulization control used to visualize the matrix data where the individual values are represented as colors

ej2, syncfusion, web components, data visualization

readme

JavaScript HeatMap Control

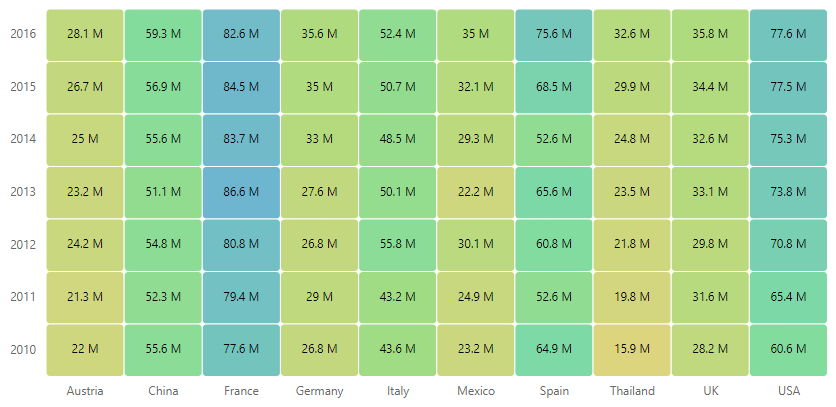
The JavaScript HeatMap control is a graphical representation of two-dimensional data where the values are represented with gradient or solid color variations. The data points are rendered as HeatMap cells using Scalable Vector Graphics (SVG) or canvas UI rendering.

Getting started . Online demos . Learn more

JavaScript HeatMap Control

Trusted by the world's leading companies Bootstrap logo

Setup

To install the HeatMap and its dependent packages, use the following command.

npm install @syncfusion/ej2-heatmap

Supported frameworks

HeatMap control is also offered in the following list of frameworks.


     Angular    

       React      

       Vue         

  ASP.NET Core  

  ASP.NET MVC  

Showcase samples

Key features

  • Data binding: Binding data in JSON and two-dimensional array formats is supported.
  • Axis types: Supports three different types of axes to populate the data, namely Numerical, Categorical and DateTime.
  • Axis: Supports inverted axis, opposed position and axis intervals.
  • Rendering modes: Supports automatic switching between SVG and Canvas rendering modes based on the data source length.
  • Palette: Different colors are provided for different value ranges to be used in the cells.
  • Legend: Summarizes the information for the colors which represents each values in HeatMap.
  • Tooltip: Provides information about the cell values on hover.
  • Selection: Supports selecting the cells that will be the center of attraction.
  • Templates: Templates can be used to create custom user experience in the tooltip of the heatmap.

Support

Product support is available through the following mediums.

Changelog

Check the changelog here. Get minor improvements and bug fixes every week to stay up to date with frequent updates.

License and copyright

This is a commercial product and requires a paid license for possession or use. Syncfusion’s licensed software, including this control, is subject to the terms and conditions of Syncfusion's EULA. To acquire a license for 80+ JavaScript UI controls, you can purchase or start a free 30-day trial.

A free community license is also available for companies and individuals whose organizations have less than $1 million USD in annual gross revenue and five or fewer developers.

See LICENSE FILE for more info.

© Copyright 2025 Syncfusion® Inc. All Rights Reserved. The Syncfusion® Essential Studio® license and copyright applies to this distribution.

changelog

Changelog

[Unreleased]

29.1.33 (2025-03-25)

HeatMap

New Features

  • #I450186 - HeatMap's axis labels can now include line break characters.
  • #I287338 - Label templates can be displayed in place of cell labels to provide additional information.

22.2.10 (2023-08-22)

HeatMap

Bug fixes

  • #I487030 - When the cancel property in the event argument of the cellSelected event is set to true, selection will now be prevented.

22.1.34 (2023-06-21)

Heatmap

New Features

  • #I437878 - The cellDoubleClick event is now available for use to initiate an event when a double click action is done over the HeatMap cells.
  • #I438083 - When the axis label exceeds the available region, it can be wrapped or trimmed using the textOverflow property in the x-axis and y-axis.

21.2.8 (2023-05-30)

HeatMap

Bug fixes

  • #F182203 - The data points in the JSON data will now be properly mapped in the HeatMap using the cell adapter with maximum and minimum properties set in the x-axis.

21.2.4 (2023-05-09)

Heatmap

Bug fixes

  • #I456795 - The extra text element in the HeatMap component's DOM has now been properly removed.

21.1.41 (2023-04-18)

Heatmap

Bug Fixes

  • #I452356 - When the x-axis labels are trimmed and rotated, the HeatMap cell area now renders properly.

21.1.35 (2023-03-23)

Heatmap

New Features

  • #F177543 - enableMultiSelect property is exposed to enable or disable multiple selection of the HeatMap cells.

20.3.60 (2022-12-06)

Heatmap

Bug Fixes

  • #I421105 - The axis labels and multilevel labels of the x-axis will be properly spaced.

20.3.56 (2022-11-08)

Heatmap

New Features

  • #I410874 - The backgroundColor property can now be used to change the color of the HeatMap's background.

20.3.50 (2022-10-18)

Heatmap

Bug Fixes

  • #I408948 - The zero value label in the y-axis will now appear correctly.

20.3.49 (2022-10-11)

Heatmap

Bug Fixes

  • #I408948 - The zero value label in the x- and y-axes will now appear correctly.

18.4.30 (2020-12-17)

Heatmap

Bug Fixes

  • #287830 - The issue with using setState in the HeatMap has been resolved.

18.4.39 (2021-01-28)

Heatmap

Bug Fixes

  • #299279 - The issue "API level styles was not taken as important for HeatMap" has been resolved.

18.2.57 (2020-09-08)

Heatmap

Bug Fixes

  • The unwanted tags were removed.

18.1.54 (2020-05-26)

HeatMap

Bug Fixes

  • #277767 - Issue with get the exact position of mouse in cell click event has been fixed.

Bug Fixes

  • #270398 -issue with tooltip while using scale has been fixed.

Bug Fixes

  • #277945 - Legend label cropping issue has been fixed.

18.1.52 (2020-05-13)

HeatMap

Bug Fixes

  • #270398 - Heatmap tooltip alignment issue has been fixed.

18.1.45 (2020-04-21)

HeatMap

Bug Fixes

  • #271846 - Legend label cropping issue has been fixed.

18.1.36-beta (2020-03-19)

HeatMap

New Features

  • #259129 - Provided the support to display the exceeding X-Axis label using the labelIntersectAction property value as MultipleRows.
  • Now the lengthier Y-Axis label can trimmed with ellipses using the maxLabelLength property.

17.4.39 (2019-12-17)

HeatMap

New Features

  • #234060, #246529 - Provided the cell color customization support for heatmap by using the cellRender event.
  • Provided the legend title support to customize the legend title in heatmap.
  • Provided the support for a cell color range to customize a cell color based on the range value.

17.3.9-beta (2019-09-20)

HeatMap

New Features

  • Provided a minimum and maximum color display based on row and column wise

Breaking Changes

The dataSource property has been split into dataSource and dataSourceSettings properties. The dataSource property is used to bind data to HeatMap and the dataSourceSettings property is used to configure the data source using adaptor settings.

17.2.28-beta (2019-06-27)

HeatMap

New Features

  • Now it is possible to customize the legend label using legendRender event.

17.1.47 (2019-05-14)

HeatMap

New Features

  • 230837, #229200 - Provided the tool tip template support for customizing the cell tool tip.

17.1.32-beta (2019-03-13)

HeatMap

New Features

  • Now it is possible to select or deselect multiple cells in Heatmap by holding CTRL key and mouse click actions.

17.1.1-beta (2019-01-29)

HeatMap

New Features

  • Now it is possible to provide minimum and maximum values for bubble size in Bubble Heatmap.
  • Provided support for resized and loaded client-side events in Heatmap. The resized event will be triggered before Heatmap being rendered and the loaded event will be triggered after Heatmap is completely rendered on window resize action.

16.4.53 (2019-02-13)

HeatMap

Bug Fixes

  • The console window exception which is thrown for mouse hovering action on legend labels in Firefox browser has been handled.

16.4.40-beta (2018-12-10)

HeatMap

New Features

  • Support for toggling the cell visibility with legend selection has been added for fixed type legend in heat map. This support helps to view the data points with values which matches the legend selection.
  • Multi-level axis label grouping feature has been added to heat map.
  • Cell selection feature has been added to heat map, this feature helps to select single or multiple heat map cells at run-time.
  • Support for binding date object to axis labels for cell JSON data has been provided.
  • Support for auto generating axis labels for cell JSON data has been provided.
  • Provided support for formatting legend label in heat map.
  • Provided support for customizing the cell tool tip UI.
  • Provided support for customizing the data labels.

16.3.27 (2018-10-23)

HeatMap

Bug Fixes

  • Axis labels tooltip cropping issue has been fixed
  • Issue with heatmap margin with minimum axis label size has been fixed.

16.3.24 (2018-10-09)

HeatMap

Bug Fixes

  • Issue with rendering heatmap with smaller dimensions has been fixed.

16.3.17 (2018-09-12)

HeatMap

New Features

  • Bubble tile type support has been included in heatmap for visualizing data points by mapping the data to bubble size and bubble color.
  • Axis label increment feature has been added to heat map. It’s is used to display the axis label with regular interval values in numeric and date time axes
  • Provided the smart legend feature for fixed type legend.
  • Provided the support for nested data binding for JSON data.

16.2.41 (2018-06-25)

HeatMap

The HeatMap control is used to visualize a two-dimensional data in which the values are represented in gradient or fixed colors.

  • Axis Types - Supports three different types of axes to populate the data, namely Numerical, Categorical,and Datetime.
  • Axis Feature - Supports inverted axis, opposed position and axis intervals.
  • Legend - Supports legend which provides value information for the colors which represents each values in HeatMap.
  • Data Binding - Supports binding data in JSON and two-dimensional array formats.
  • Rendering Modes - Supports automatic switching between SVG and Canvas rendering modes based on the data source length.